By Paulo Freitas de Araujo Filho
This is the second blog post of our series “Empowering Intrusion Detection Systems with Machine Learning”, where we discuss how machine learning can empower IDSs so that they detect complex and unknown cyber-attacks more effectively. In our first post, we discussed that there are four methods that are most commonly used in state-of-the-art unsupervised IDSs: clustering, one-class novelty detection, autoencoders, and generative adversarial networks (GANs). Now, we will dig a little deeper and focus on the first of these methods and discuss how clustering techniques are used in unsupervised IDSs.
Clustering algorithms analyze and arrange data samples into groups according to their similarity, i.e., samples that are similar to each other are grouped together in the same cluster, and samples that are different from each other are put into different clusters [1]-[3]. While the idea of similarity and difference between data samples may be a little abstract, it is usually related to a chosen distance metric. Hence, two samples are said to be similar if the distance between them according to a chosen metric is below a threshold. Otherwise, they are said to be different [1]-[3]. To illustrate, imagine that each data sample can be represented by a point. Thus, we can choose the Euclidean distance, i.e., the length of a line segment, and measure the distance between each data point so that we evaluate whether they are close or far away from each other.
Since malicious activities usually differ from the benign behavior, clustering algorithms can be used to detect cyber-attacks in IDSs [1]. In the following, we discuss two approaches for detecting malicious activities, and anomalies in general, with clustering techniques.
A Malicious Cluster
A simple approach for detecting anomalies is to use clustering algorithms to analyze a group of data samples collected from networks and systems, and group them into two clusters. Since malicious samples are much less frequent than benign samples, it is expected that the vast majority of samples are benign. Thus, the largest cluster is considered to comprise benign samples and the smallest cluster is considered to comprise malicious samples [4]. Then, at detection time, samples are evaluated and assigned to the malicious or benign cluster so that the cluster to which they are assigned indicates whether they are malicious or benign [1].
No Cluster for Attackers
A different, more robust approach for detecting anomalies is to let the clustering algorithm freely form as many clusters as it wants and to not have to assign every sample to a cluster [5], [6]. That is, while dozens of clusters may be formed, some samples may not be assigned to any of them. Differently from the previous approach, which assigned malicious samples to a cluster, each formed cluster is now considered to comprise different types and behaviors of benign data and malicious samples are those that are not assigned to any of the constructed clusters. At detection time, samples are evaluated and assigned to one or none of the clusters so that they are considered to be malicious in the latter case [1].
Enabling Other Detection Algorithms
Although unsupervised IDSs do not explicitly require labels, many of them need to ensure that only bening data is used for training their detection algorithms. Those IDSs learn a pattern of normal data and consider deviations from that pattern as malicious activities. Hence they cannot afford to have malicious training samples as it would compromise the learnt pattern and, consequently, the IDS accuracy. Therefore, while clustering techniques can be directly applied to detect anomalies, they can also be combined to unsupervised IDSs to ensure that they are trained with only benign data. As an example, the work in [4] used the k-means algorithm to construct two clusters for network traffic samples from a Wi-Fi network. Then, it considered that the smallest cluster represented malicious traffic and filtered out the malicious samples to build a more accurate baseline of normality, which was later used to train other detection algorithms.
On the other hand, supervised IDSs require that training samples are labeled as normal or malicious, and even as different types of malicious samples when different malicious activities need to be distinguished. However, manually analyzing large amounts of data samples for obtaining labels is impractical and very costly. Thus, as clustering techniques group together similar samples, they can significantly reduce the number of manually analyzed samples by allowing that the label of one sample of a cluster is used for all of its samples [1].
Clustering Algorithms
Now that we have discussed how clustering can be leveraged by IDSs, we briefly discuss two of the most used clustering algorithms: k-means [7] and Density-Based Spatial Clustering of Applications with Noise (DBSCAN) [5].
K-Means
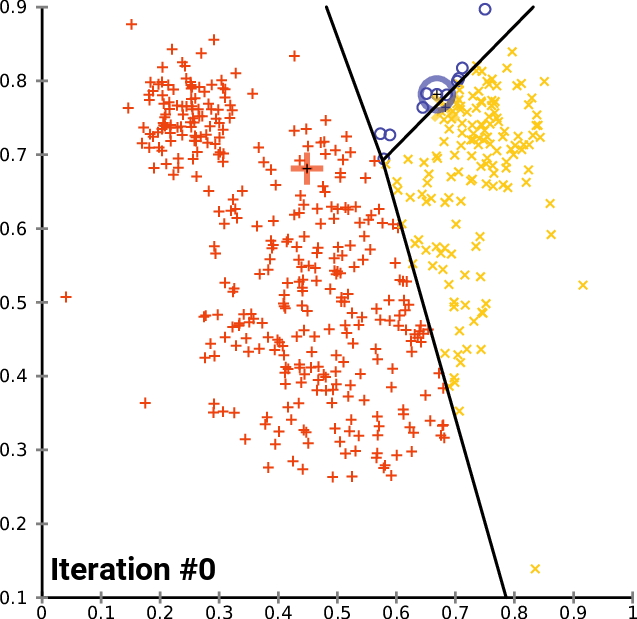
Given a group of data samples, the goal of k-means is to create a number k of clusters so that each data sample belongs to one of the clusters [7], [8]. The first step in constructing the clusters is to randomly select k centroids, which are representations of the center of each cluster. In simple words, if each data sample can be represented by a point, the centroid of a cluster is the point that is the center of that cluster. Then, three other steps are repeated for updating the clusters until their centroids have stabilized and no longer change [4], [7], [8]:
- The Euclidean distance is calculated between each centroid and all data samples.
- Each sample is assigned to the closest centroid forming the clusters.
- Each cluster centroid is updated by averaging the distance between the data samples within each cluster.
Figures 1, 2, and 3 illustrate the construction of clusters.
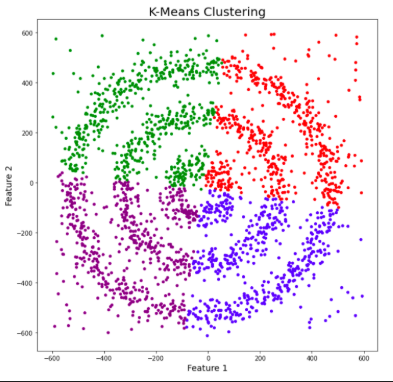
While the k-means algorithm is simple and intuitive, it requires that we specify beforehand the number of clusters that will be formed. However, it is not always an easy task to do so. Moreover, the k-means performance is usually not as competitive as other more sophisticated clustering algorithms, such as the DBSCAN, as it assumes spherical cluster formats and slight variations in samples could significantly impact the formed clusters [1], [11].
DBSCAN
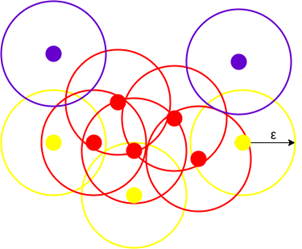
DBSCAN is a density-based clustering algorithm that works on the assumption that clusters are dense regions in space separated by regions of lower density [5], [6]. It groups together samples that are close to each other according to a distance metric, which is usually the Euclidean distance, and a minimum number of samples that must belong to each cluster. Hence, the DBSCAN algorithm has two parameters: the radius of the circle that is created around each data sample to check the density, and the minimum number of samples that are required to be inside a circle so that a cluster is defined [5], [6].
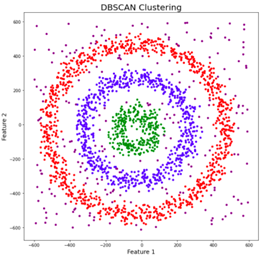
For a chosen radius and minimum number of points, the algorithm draws a circle with the chosen radius for each data sample. The samples whose circle contains at least the chosen minimum number of samples are considered to be core points. All core points that are connected to each other, i.e., that also belong to the circles of the other core points, form together a cluster. The samples whose circle contains fewer samples but at least one other sample are considered to be border points as they represent the border of a cluster. Finally, the samples whose circle does not contain any other sample are considered to be outliers as they are in low-density regions [5], [6]. Figure 4 illustrates core points in red, border points in yellow, and outliers in blue. Figure 5 shows three clusters in red, blue, and green, and outliers in low-density regions.
The DBSCAN algorithm allows that data samples are not assigned to any cluster if they are in low-density regions. Such samples are considered to be outliers as they represent samples that do not conform to the patterns of each cluster. Does it sound familiar? Yes, those data samples are anomalies that may represent cyber-attacks. Therefore, the DBSCAN can be used as an unsupervised IDS [1].
Furthermore, in contrast to other clustering techniques, the DBSCAN does not require that the number of clusters are specified beforehand, which makes things much easier as we may not know in advance how many patterns can be discovered. Besides, it allows clusters with arbitrary shapes to be formed, which usually contributes to better results than those other algorithms that impose spherical formats [1], [11]. On the other hand, it may be challenging to determine the appropriate DBSCAN parameters and to group data samples that have very different cluster densities [5], [6].
Deployment
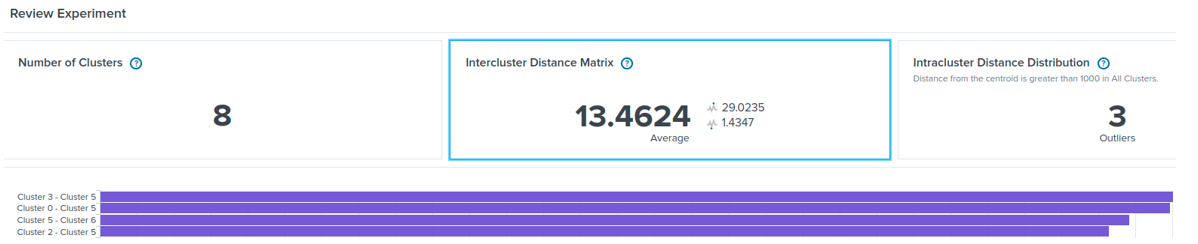
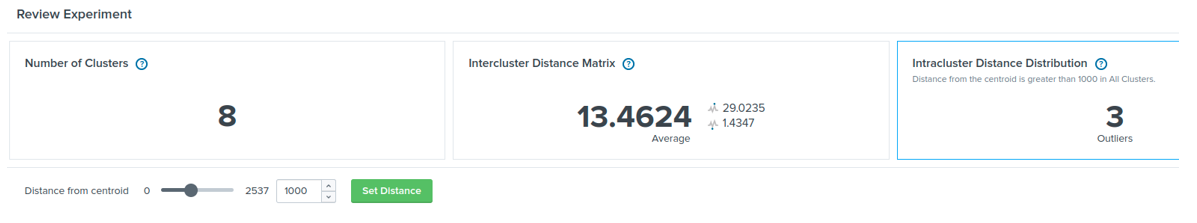
Splunk is one of the most used security information and event management (SIEM) platforms, which gathers, manages, and correlates data, and deploys cyber-attack detection rules. Splunk’s machine learning toolkit (MLTK) offers several machine learning algorithms, such as K-Means and DBSCAN. Those algorithms can be configured, trained, and deployed in Splunk as anomaly-based detection models just as any other signature-based detection rule. For instance, Figure 6 shows the distance between eight clusters formed with the K-Means algorithm. Figure 7 shows that three data samples from a given set have a higher distance than a predefined cluster distance so that they represent anomalies. For more information, please refer to [12].
Challenges and Drawbacks
Although IDSs based on clustering techniques have an important role when there are no labels available, they might be very challenging to configure and train in highly dynamic systems as the data behavior will be constantly changing. Moreover, since SIEMs usually monitor a massive amount of data, it is very challenging to construct clusters that represent the different behaviors of data well and efficiently, while detecting anomalies with low false positive rates.
Conclusion
As discussed, clustering techniques have an important role in unsupervised IDSs by directly detecting anomalies or reducing the number of data samples that need to be manually analyzed by cyber-security experts. At Tempest, we are investigating the use of clustering techniques and the proposal of novel ones to better protect your business! Stay tuned for our next post!
References
[1] A. Nisioti, A. Mylonas, P. D. Yoo and V. Katos, “From Intrusion Detection to Attacker Attribution: A Comprehensive Survey of Unsupervised Methods,” in IEEE Commun. Surveys & Tut., vol. 20, no. 4, pp. 3369-3388, Fourth quarter 2018, doi: 10.1109/COMST.2018.2854724.
[2] N. Chaabouni, M. Mosbah, A. Zemmari, C. Sauvignac, and P. Faruki, “Network Intrusion Detection for IoT Security Based on Learning Techniques,” IEEE Commun. Surveys & Tut., vol. 21, no. 3, pp. 2671–2701, 2019. doi: 10.1109/COMST.2019.2896380.
[3] V. Chandola, A. Banerjee, and V. Kumar, “Anomaly detection: A survey,” ACM Comput. Surveys, vol. 41, no. 3, p. 15, 2009.
[4] I. Ghafir, K. G. Kyriakopoulos, F. J. Aparicio-Navarro, S. Lambotharan, B. Assadhan and H. Binsalleeh, “A Basic Probability Assignment Methodology for Unsupervised Wireless Intrusion Detection,” in IEEE Access, vol. 6, pp. 40008-40023, 2018, doi: 10.1109/ACCESS.2018.2855078.
[5] E. Schubert, J. Sander, M. Ester, H. P. Kriegel, and X. Xu, “DBSCAN revisited, revisited: Why and how you should (still) use DBSCAN,” ACM Trans. Database Syst., vol. 42, no. 3, pp. 19: 1-21, Jul. 2017.
[6] A. Sharma. How to Master the Popular DBSCAN Clustering Algorithm for Machine Learning. Accessed: Mar. 09, 2022. [Online]. Available: https://www.analyticsvidhya.com/blog/2020/09/how-dbscan-clustering-works/
[7] D. Arthur and S. Vassilvitskii, “K-Means++: The advantages of careful seeding,” in Proc. Symp. Discrete Algorithms, 2007, pp. 1027–1035.
[8] R. Halde. K-means Clustering: Understanding Algorithm with animation and code. Accessed: Mar. 09, 2022. [Online]. Available: https://halderadhika91.medium.com/k-means-clustering-understanding-algorithm-with-animation-and-code-6e644993afab
[9] Wikimedia Commons. K-means convergence.gif. Accessed: Mar. 09, 2022. [Online]. Available: https://commons.wikimedia.org/wiki/File:K-means_convergence.gif
[10] A. A. Shabalin. K-means clustering. Accessed: Mar. 09, 2022. [Online]. Available: http://shabal.in/visuals/kmeans/5.html
[11] M. G. Gumbao. Best clustering algorithms for anomaly detection: Mar. 09, 2022. [Online]. Available: https://towardsdatascience.com/best-clustering-algorithms-for-anomaly-detection-d5b7412537c8
[12] Splunk. Manuals Splunk® Machine Learning Toolkit: Jun. 23, 2022. [Online]. Available: https://docs.splunk.com/Documentation/MLApp/latest
Other articles in this series
Empowering Intrusion Detection Systems with Machine Learning
Part 1 of 5: Signature vs. Anomaly-Based Intrusion Detection Systems
Part 2 of 5: Clustering-Based Unsupervised Intrusion Detection Systems
Part 3 of 5: One-Class Novelty Detection Intrusion Detection Systems
Part 4 of 5: Intrusion Detection using Autoencoders
Part 5 of 5: Intrusion Detection using Generative Adversarial Networks