By Lucas Deodato & Manoelito Filho
Introduction
Zabbix is a monitoring platform that makes it possible to supervise the health and availability of network parameters, virtual machines, servers, applications, services, cloud entities, etc. It offers flexible features for notifying interested parties (stakeholders) through a variety of communication channels (instant messengers, email services, SMS, etc.), thus enabling a rapid response to detected problems.
The Security Operations Center (SOC) has, among its many responsibilities, the role of monitoring, detecting and responding to security incidents. As for the CID triad, in addition to confidentiality and integrity, the availability of certain assets or services can be interpreted as critical security incidents, such as the unavailability of a SIEM (Security Event Management and Correlation). Therefore, the teams responsible need to be activated assertively and effectively to restore the systems.
The challenge of monitoring complex, heterogeneous and distributed topologies requires a thorough analysis of possible failure scenarios, and it’s crucial that alerts should be reliable. From this perspective, if more than 10% of all alerts are false positives, users tend not to trust the monitoring (NICOLA MAURI, 2020). Another undesirable phenomenon is alert flooding, because if the main channel for receiving actionable alerts is flooded, the Incident Handling or Platform teams may not identify the real issues (SUNDARAMURTHY, 2014) and, when it comes to designing an SOC, these are the worst-case scenarios.
Goal
The aim of this article is to present methods of correlation and intelligence of the metrics and conditionals of alerts in order to reduce false positives, mitigate alert floods, as well as trigger the specific teams that are responsible for restoring systems, from the perspective of an SOC.
Environment
This article presents a laboratory made up of a Zabbix Server and a host to be monitored, with the aim of simulating some of the recurring problems of an SOC. To do this, VirtualBox was used as a hypervisor in version 6.1.38 to create two virtual machines (VMs) to represent the aforementioned assets.
Both machines use operating systems based on Red Hat Enterprise Linux (RHEL-based) to bring them closer to the real SOC monitoring scenario. In addition, the VMs have their network cards in bridge mode so that they can be part of the local network.
Monitoring target host: Uses the CentOS 7.9 operating system, with the Zabbix Agent 2 service installed in version 5.0.21.
Zabbix Server: Service version 6.0.12 with Oracle Linux operating system version 8.5.
Basic flow of Zabbix alerts in an SOC

The Zabbix Agent (or just Agent) is responsible for collecting information about the system to be monitored, such as CPU, memory, disk usage, service information and availability, etc. Zabbix Server (or just Server) is responsible for receiving and storing the information collected by the agent and other monitoring devices, such as SNMP, JMX and IPMI. The default service port is 10050.
The Server processes the information collected through triggers which, when met, can generate actions such as notifying stakeholders. Triggers are logical expressions that have conditions to detect unwanted scenarios.
For this article, when a trigger is activated, Server will take the action of notifying the team responsible for re-establishing the availability of the issuescenario in question.
Techniques for reducing false positives and flooding alerts
The concept of a false positive for a SOC relates to the full reliability of the alert, ruling out intermittencies. Therefore, alert logics must be created that filter out fluctuations and temporary interruptions in the quantity being monitored, because, as mentioned, false positives damage the reputation of the monitoring system when they interfere with the reliability of alerts, just as floods of notifications interfere with the visibility of real problems. We’ll therefore demonstrate some effective techniques for mitigating these problems in Zabbix.
Triggers with anti-flapping techniques
First, let’s analyze a simple trigger:
last(/CentOS/vm.memory.size[pused])>95
Block 1 – Example trigger.
- “last”: Function used by the expression. Considers the last piece of information collected.
- “CentOS”: Name of the monitored host.
- vm.memory.size[pused]”: Name of the object (item) to be monitored. In this case it will be the percentage of memory used (pused: percentage used).
- “>95”: Indicates the condition that must be met for the trigger to be activated, i.e. when the percentage of memory used is greater than 95%.
In this way, the trigger will generate an alert when the last value collected for memory usage on the CentOS host exceeds 95%.
There are several other ways to analyze metrics for items of interest. Based on the previous example, take a look at the following triggers in Block 2:
# SMTP indisponível
last(/Host/net.tcp.service[tcp,,25])=0

# Serviço de SSH indisponível
last(/LinuxMachine/net.tcp.service[tcp,,22])=0

# Zabbix Agent indisponível
last(/ZabbixAgentHost/net.tcp.service[tcp,,10050])=0
Block 2 – Other trigger examples.
Can you identify any problems with this monitoring strategy? Think about it. It’s common for some services to experience fluctuations or isolated problems for short periods of time. For example, imagine that the service responsible for sending email was unavailable for about four minutes due to a temporary fluctuation in the network. In this way, if we were monitoring every minute, we would have four unnecessary downtime alerts (false positives).
In the context of network monitoring, the term flapping is used to refer to a rapid and frequent oscillation in the state of a monitored item and, for this reason, anti-flapping techniques are used to avoid excessive generation of notifications during these oscillations.
The technique is simple: just setimpose a waiting period based on the historical behavior of the object to be monitored. Normally, the average of the unavailability events plus their standard deviation is taken into account, in case the problem persists for a while, in order to avoid false positives. This choice should take into account the criticality of the environment, the severity of the outage for stakeholders and its impact based on a risk matrix.
Scenario 1: Anti-flapping.
To simulate the oscillation scenario, a Python script was created to disable the SSH, SMTP and Zabbix Agent services for random intervals of a maximum of 75 seconds. After this time, the program re-enables the services for 45 seconds – enough time for Zabbix to detect that the services have been re-established – and finally repeats all the previous steps 4 more times to cause more oscillations. See the number of alerts generated and their duration in Figure 2.
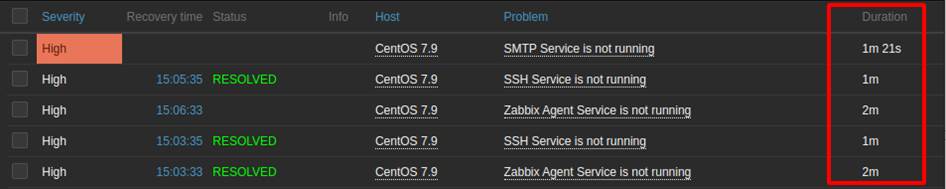 Figure 2: Oscillations in service availability caused by the script. – Source: Authors of the article
This is because the last() function uses the last value collected. In this context, as soon as the services stopped, several alerts with categorically short duration times were generated, which in turn characterizes false positives. The solution proposed to correct this problem was implemented in two steps:
Step 1: Carrying out an analysis to check the average duration time plus its standard deviation of service fluctuations and determining a waiting time within a low-risk scenario.
Step 2: Implementation of anti-flapping techniques to modify the expressions using a new function: max().
In this way, the triggers were structured as shown in Figure 3.
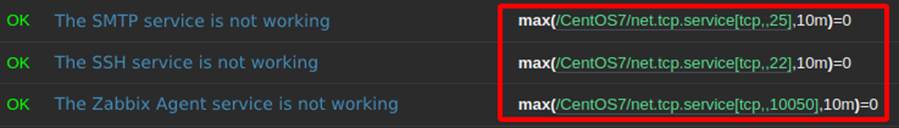
Figure 3: New triggers with anti-flapping techniques, using the max() function. – Source: Authors of the article
The max() function will return the maximum value collected in a specified time interval, which in the current example is ten minutes. Equal to zero (=0) is the trigger condition, which will be triggered if the maximum value of all collections in the last ten minutes is equal to zero. In other words: if each service is unavailable for ten minutes, the alert will be generated.
The ten-minute interval for the laboratory simulation was chosen based on criteria from a real SOC scenario. “Dialogue between the Zabbix administrator team and the one responsible for restoring each outage is an important factor for monitoring, since the service may have some specificity that requires a shorter or even longer interval given each specific circumstance and context.
The temporary oscillations were mapped and stored by Zabbix as shown in Figure 4; however, after applying the anti-flapping techniques, there were no more false positives in the laboratory as shown in Figure 5.
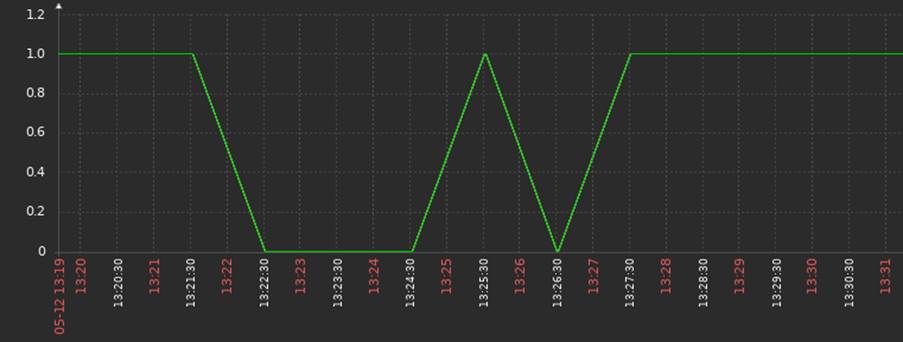
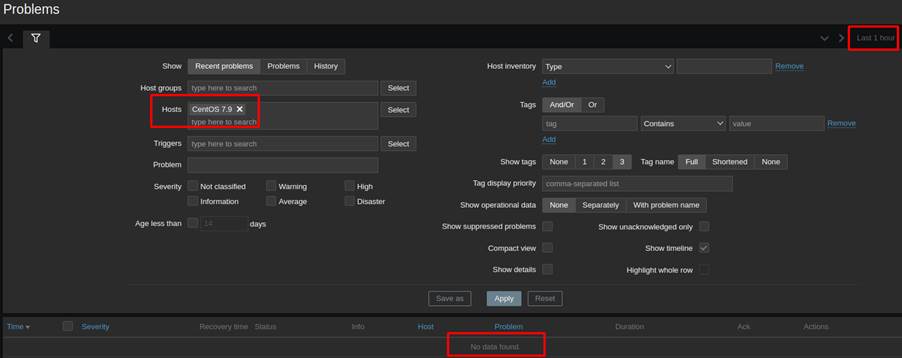 Figure 5: History of problems over the last hour on the monitored host. – Source: Authors of the article
Therefore, the operation of the SOC remained with visibility of the oscillations for auditing purposes and without any characteristics of flooding or false positives from the perspective of the metrics implemented.
Correlation of logics to categorize availability problems
Zabbix offers the agent.ping object (item) which helps monitor the availability of the Agent service response: if it’s available, it returns one and if it’s not, it returns nothing, unlike ICMP (Internet Control Message Protocol) monitoring which returns the classic error messages (POSTEL, 1981).
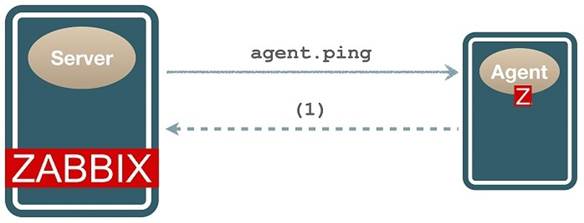
In other words, in a scenario where the Agent stops working, there will be no data to be collected by the Server, resulting in a gap in the monitoring history. One possible solution to identify this unavailability of the service is to use a function that observes when no data has been collected in a certain time window: nodata().
Sometimes the logical conditions are difficult to understand. The behavior of the nodata() function can be a little confusing at first glance because it’s a negation function, so it’s important to note that:
nodata()=1 indicates that no data was received in the given period, in this case, no data for 3 minutes.
nodata()=0 indicates that there was data received in the given period, so the trigger does not activate.
Therefore, internalize the following form: nodata()=1 can be read as “there was no data in this period = This is true“.
Using the nodata() function in conjunction with agent.ping identifies a probable host outage, but it could just be a problem with the Agent service or even a network outage. In this way, identifying the root cause of the unavailability provides assertiveness in triggering the appropriate team to solve the problem in an SOC.
The ping (ICMP) and port availability check features of a service are commonly used in network measurements. In this way, we can correlate the logics to assertively determine which is most likely to be a root cause, as seen in Table 1:
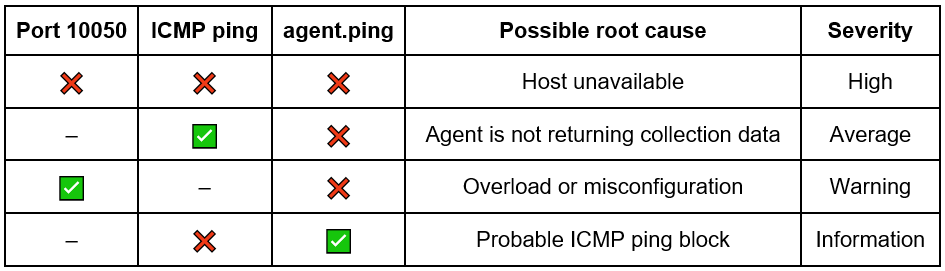 Table 1: Correlated conditions to categorize the possible root cause.
It’s worth noting that if the service port is active (10050) and agent.ping is not, we have an anomaly, an abnormality, unexpected behavior. This can be generated by various scenarios, such as: service overload, operating system overload, Agent freeze/crash, or even misconfiguration in the firewall rules or the Agent itself. For simplicity, let’s assume the “Overload or misconfiguration” situation.
After determining the source of the problem, it becomes possible to more reliably direct alerts to the correct teams, as shown in Table 2.
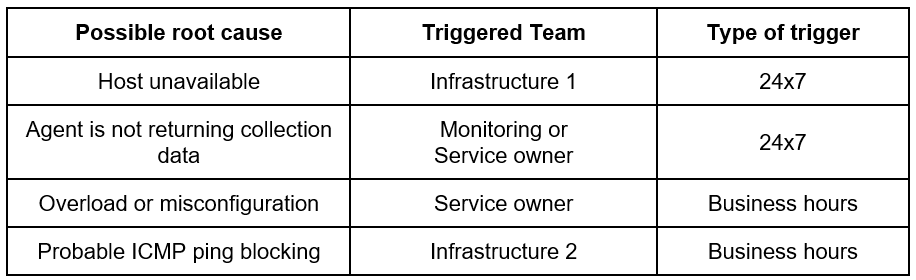
When the correct team is activated, operational agility is gained as a whole and, as such, it’s necessary to correlate the events in order to assess the possible root cause appropriately.
Scenario 2: Correlation
In this scenario, we’ll demonstrate how the correlation of triggers works using the dependent trigger feature with association between metrics. The new triggers will be a little more complex than in Scenario 1 (anti-flapping).
Associations between ICMP ping with agent.ping and service port verification with agent.ping will be covered. These associations using Boolean AND logic with the use of trigger dependencies are sufficient to assess the possible root causes mentioned above.
- Trigger composed of ICMP Ping and agent.ping
max(/CentOS/icmpping,5m)=0 and nodata(/CentOS/agent.ping,5m)=1
Block 3: Trigger that crosses ICMP ping with agent.ping.
This trigger checks that the host is not responding to ICMP Ping and that the Agent is not returning collection data, both for more than five minutes. If both conditions are met, the alert for the unavailable host root cause will be triggered.
To simulate the unavailable host scenario, the host’s internet connection was disabled, generating a network outage, as seen in Figure 9.
A trigger was then fired in Zabbix, indicating that the host was unavailable, as shown in Figure 8.

2. Agent.ping trigger configured as dependent on the previous one.
A new trigger is then configured to detect when only the Agent is not returning collection data for more than ten minutes. Note that this condition is part of the previous trigger (Block 3).
nodata(/CentOS/agent.ping,10m)=1
Block 4: Trigger to detect non-collection of Agent data
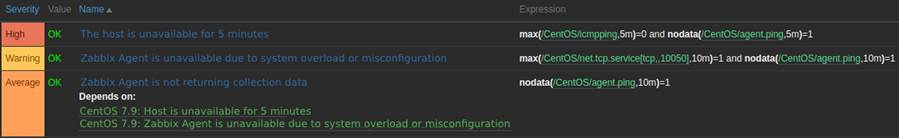
Therefore, in order for the root cause to be properly assessed, it’s necessary to implement the trigger dependency feature. The configuration is simple and should be consulted in the official documentation [1]. Figure 9 shows the dependency of the trigger “Agent is not returning collection data” with “Host is unavailable”. It’s important to note that when one trigger depends on another, it’s necessary to size the time of each one appropriately so that the correlation is effective.
As well as assessing the root cause, trigger dependencies also prevent duplicate alerts. It works as follows: if the “Host unavailable” trigger is being fired, the dependent trigger will not fire. By doing this, we’re telling Zabbix that if the host is unavailable, naturally the Zabbix Agent service will be too, so it won’t need two alerts to handle the SOC.
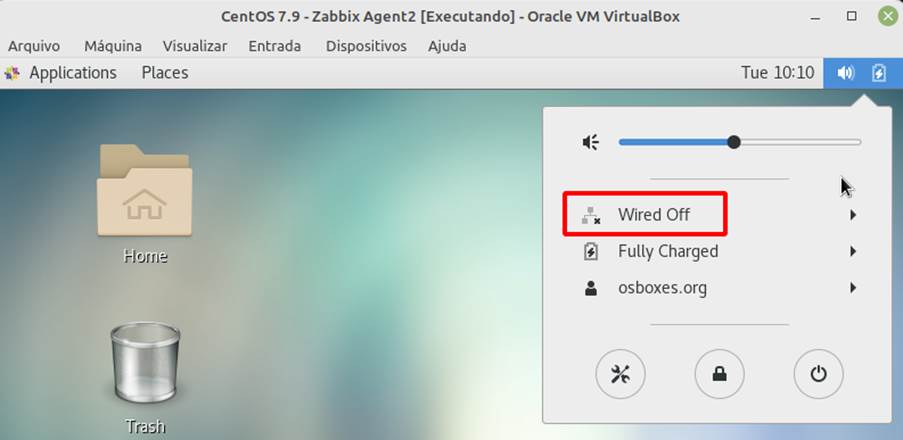
To replicate this scenario, the Agent service was disabled as shown in Figure 10.
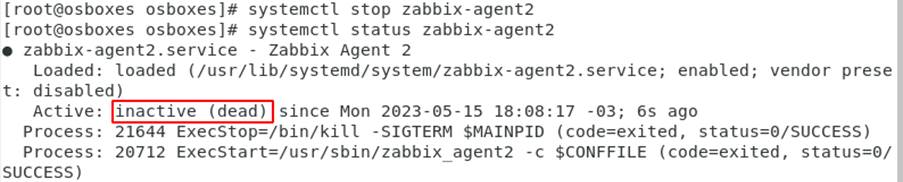 Figure 10: Zabbix Agent service inactive – Source: Authors of the article
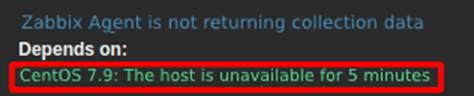
After ten minutes, the alert was generated, with the possible root cause identified appropriately, as shown in Figure 11.

In addition, the dependency is also working correctly, as shown in Figure 12, which shows the unavailable host trigger in the problem state and the one that identifies the absence of collection data remains as “ok”.

The next correlation scenario identifies when the service port (10050) is active and the Agent is not communicating, thus configuring a possible overload or misconfiguration scenario.
3. Trigger “Zabbix Agent is unavailable due to system overload or misconfiguration”
Block 5 shows the trigger to identify a possible crash or misconfiguration problem in the Agent by monitoring if both the service port (10050/TCP) and the Agent’s collection data return aren’t active.
max(/CentOS/net.tcp.service[tcp,,10050],5m)=1 and nodata(/CentOS/agent.ping,5m)=1
Block 5: Trigger to detect agent overload or misconfiguration problems
The item net.tcp.service[tcp,,10050] collects the service port status by simple check (telnet style, netcat, etc.) instead of using the Agent’s own port check feature. This ensures that the information is collected via another channel because, obviously, if the Agent isn’t working properly, the service port information won’t be returned.
In order for the Agent to be able to send the information to the Zabbix Server, its IP must be added to the service configuration file. Therefore, to simulate a scenario in which this trigger is activated, an incorrect IP was added to the Zabbix Agent configuration file and the trigger was fired, as shown in Figure 13.

Similarly to the previous case, the “Zabbix Agent is not returning collection data” trigger needs to be dependent on this one to avoid duplicate alerts.
In this way, we have the correlation between three different items to identify three different possible root causes and the logics presented contain all the techniques explained throughout this article:
- Anti-flapping to avoid flooding alerts when there are several oscillations, to reduce false positives and improve monitoring reliability;
- Correlation with expressions that identify the possible root cause of alerts to trigger the teams responsible for fixing the problems;
- Dependence on triggers to avoid duplicate alerts and unnecessary triggers.
Conclusion
This article has presented the importance of mitigating false positives and flooding alerts so that an SOC can function reliably in its monitoring and triggers. In this way, adverse and common operational scenarios were demonstrated through a laboratory exploring anti-flapping techniques and correlation with dependencies.
Reducing false positives and improper triggers avoids financial losses for the parties involved. In addition to labor costs, poor monitoring can lead to SLA (Service Level Agreement) breaches, greater exposure to cyber attacks and even a scenario in which an incident occurs and cannot be detected or responded to.
Gains in assertiveness and activation of the appropriate teams contribute to improvements in performance indicators such as MTTA (Mean Time To Acknowledge) and MTTR (Mean Time To Respond), which are, respectively, the average time to acknowledge and respond to an incident, thus resulting in a substantial improvement in the security of the monitoring system and the SOC as a whole..
References
LONTONS, Arturs. Handy Tips #19: Preventing alert storms with trigger dependencies. Disponível em: <https://blog.zabbix.com/handy-tips-19-preventing-alert-storms-with-trigger-dependencies/18696/>. Acessed on: January 05, 2023.
MAURI, Nicola. Fighting notification floods and misleading alerts in distributed Zabbix deployments. Available at: <https://blog.zabbix.com/fighting-notification-floods-and-misleading-alerts-in-distributed-zabbix-deployments/11600/#:~:text=False>. Acessed on: January 14, 2023.
POSTEL, Jon. RFC 792 – Internet Control Message Protocol. 1981. Available at: <https://datatracker.ietf.org/doc/html/rfc792>
Secure Users & Access. Available at: <https://www.checkpoint.com/cyber-hub/threat-prevention/>. Acessed on: May 19, 2023.
SUNDARAMURTHY, Sathya Chandran et al. A tale of three security operation centers. In: Proceedings of the 2014 ACM workshop on security information workers. 2014. p. 43-50.
VLADISHEV, Alexei. No more flapping. Define triggers the smart way. Available at: <https://blog.zabbix.com/no-more-flapping-define-triggers-the-smart-way/1488/>. Acessed on: February 11, 2023.
WUTZL, Eduardo. [Noc] Chuva de Alertas, qual Remédio? Available at: <https://pt.linkedin.com/pulse/noc-chuva-de-alertas-qual-rem%C3%A9dio-eduardo-wutzl>. Acessed on: January 13, 2023.
Zabbix Manual. Available at: <https://www.zabbix.com/documentation/6.0/en/manual>. Acessed on: March 26, 2023.