By Lucídio Neto
1. Introduction
Given the simplicity with which cloud resources can be used, it’s not too difficult to make a mistake and/or configuration error in a resource and, as a result, expose more information than you should.
We must bear in mind that the damage caused by a data leak is infinite and the losses are countless. They can range from the exposure of a simple IP address to the potential closure of an account due to the possession of the root user’s credentials. Naturally, the severity of the problem will depend on the type of data that has been leaked.
There are two essential aspects to consider: first, detecting the flaws and, second, the measures needed to correct them. We won’t dive into the details of how to proceed with the corrections, as this naturally depends on the particularities of each environment. Instead, we’ll focus our attention on suggestions for setting up a mechanism that will identify faults and make them visible to administrators.
We’ll follow a simple, low-cost approach to scanning for vulnerabilities and evaluating cloud resources in order to mitigate errors and, consequently, reduce the risk of information exposure due to misconfiguration practices.
The approach is known in the market as CSPM (Cloud Security Posture Management). Cloud security posture management tools generally automate the identification, enumeration and suggested correction of risks in cloud infrastructures, including Infrastructure as a Service (IaaS), Software as a Service (SaaS) and Platform as a Service (PaaS).
To illustrate the solution, we’re going to use the cloud concepts of AWS* as an example. However, the same approach can easily be applied to any other provider, since the tool can be configured to operate with the main cloud solutions currently available.
Therefore, this publication aims to present a relatively simple idea that professionals or those interested in this cybersecurity issue can implement in their clouds in order to identify possible configuration flaws.
Scenario description
It’s good cloud practice to use separate accounts for a system’s development, approval and production environments. However, in this article we’ll only use a single account to illustrate the implementation of this type of scenario. Nevertheless, it should be noted that this type of solution also works and can be adapted for use with multiple accounts.
The proposed scenario relies on an EC2 (Elastic Compute Cloud) instance on AWS, configured in the region of Virginia with the CloudSploit*, LogStash* and ElasticSearch* tools installed on it. However, you can also use a VPS (Virtual Private Server) type server, an On-Premises server or, in a very special case, even the Administrator’s own machine, if they want to do it on their own AWS account.
In the example below, Image 1 shows the instance containing CloudSploit using an AWS user and scanning the other services in the account.
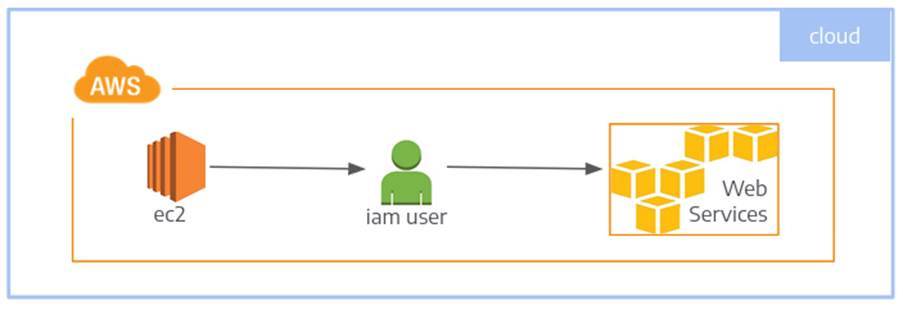
The process flow will be: CloudSploit performs the scans, makes the result available in a directory so that a script can import the result into ElasticSearch using LogStash.
To enable the scan using CloudSploit, it was decided to create a user on AWS and grant this user the permissions contained in the SecurityAudit policy managed by AWS itself.
The purpose of using the user was to explain the idea that this concept can be reproduced on a personal laptop or on a machine outside of AWS, in which case the use of Accesskey/Secretkey credentials is necessary.
There’s one warning about using Accesskey/Secretkey. This procedure is only recommended for machines outside of AWS, as in these cases there is no other alternative to enable access. Following good security practices, in the case of machines on AWS, the use of a Role is recommended to reduce the risk of credential leakage.
The Role to be used must contain the SecurityAudit policy and must be attached to the EC2 instance. The use of the SecurityAudit policy is recommended because the policy grants access to some configuration details that the ReadOnly and ViewOnly policies do not. So, in order not to have a myopic view of the configurations, we opted for SecurityAudit.
Below we’ll detail each of the items mentioned as a way of helping readers interested in replicating them and obtaining the advantages proposed by the solution presented.
2. Server environment
This section describes the items installed on the EC2 instance, such as CloudSploit, LogStash and ElasticSearch, as well as the procedures adopted to create the EC2 instance itself.
As seen in “Image 1”, a single EC2 instance is enough to carry out the necessary procedures for scanning and making the results available. This instance contains all the tools necessary for the proper fulfillment of this warrant 😀
2.1. Operational system
The EC2 instance was created in the Virginia region using an AMI (Amazon Image) from Linux Debian 11. This AMI was chosen from the list of AMIs maintained and managed by the Debian Distribution team itself, which is available at:
- https://wiki.debian.org/Cloud/AmazonEC2Image/Bullseye
The instance was also configured using an Elastic IP, so that the IP would not be changed in the event of a possible stop/start in the instance.
2.2 CloudSploit
CloudSploit is an open source project designed to detect security risks in the cloud environment. It works in the AWS, Microsoft Azure, Google Cloud Platform (GCP), Oracle Cloud Infrastructure (OCI) and GitHub environments.
The CloudSploit scripts are designed to perform a scan and return a series of security risks potentially caused by configuration failure.
The installation was carried out in the /opt/cloudspoloit/scripts directory, to do this NodeJS was installed and followed by the commands below:
$ git clone [email protected]:cloudsploit/scans.git
$ npm install
Once installed, the /opt/cloudsploit/bin/ script called cloudsploit.sh was created, which runs CloudSploit and makes the result available to be imported by LogStash into ElasticSearch.
#!/bin/bash

dirbase="/opt/cloudsploit"
conffile="${dirbase}/scripts/cloudsploit.json"
datahora="$(date +%F-%H-%M)"
logfile="${dirbase}/log/cloudsploit.log"

if [ ! -d "${dirbase}/data/${datahora}" ]; then
   mkdir -p ${dirbase}/data/${datahora}
   echo "${dirbase}/data/${datahora} was created" >> ${logfile}
fi

echo "running cloudsploit" >> ${logfile}
cd ${dirbase}/scripts
./index.js --collection ${dirbase}/data/${datahora}/cloudsploit-collection.json \
  --config ./config.js --csv ${dirbase}/data/${datahora}/cloudsploit.csv
Running the script will make the scan result available in the directory /opt/clouldsploit/data/, into a directory named after the date of the scan. This result will be used by LogStash to import it into ElasticSearch.
In the code presented, more specifically with regard to the “conffile” variable, there is a reference to a file called cloudsploit.json which should exist in the /opt/cloudsploit/scripts directory and which will contain the accesskey and secretkey of the user who will be utilized to perform the scans.
The cloudsploit.json file should be like the example below. Naturally, the characters X and x should be replaced by their respective accesskey and secretkey values respectively.
{
   "accessKeyId": "XXXXXXXXXXXXXXXXXXXX",
   "secretAccessKey": "xxxxxxxxxxxxxxxxxxxxxxxxxxxxxxxxxxxxxxxx"
}
The template for the cloudsploit.json file, in the form shown, is in the tool’s documentation. However, the execution of cloudsploit accepts the declaration of the access credential via an environment variable, which is even more recommended in order to avoid storing the credential in plain text.
In the case of an AWS machine that is using a role for access, we can execute the following commands to load the accesskey/secretkey credentials. At first, the access token is loaded into the metadata and then the role information is consulted; these are the commands.
TOKEN=`curl -X PUT "http://169.254.169.254/latest/api/token" -H "X-aws-ec2-metadata-token-ttl-seconds: 21600"`

curl -H "X-aws-ec2-metadata-token: $TOKEN" -v http://169.254.169.254/latest/meta-data/iam/security-credentials/Role-Used
With the TOKEN variable loaded as shown, executing the curl command listed will result in the temporary access credentials being displayed.
$ curl -H "X-aws-ec2-metadata-token: $TOKEN" -v http://169.254.169.254/latest/meta-data/iam/security-credentials/Role-Used
*   Trying 169.254.169.254:80...
* Connected to 169.254.169.254 (169.254.169.254) port 80 (#0)
> GET /latest/meta-data/iam/security-credentials/Role-Used HTTP/1.1
> Host: 169.254.169.254
> User-Agent: curl/7.74.0
> Accept: */*
> X-aws-ec2-metadata-token:
XXXXXXXXXXXXXXXXXXXXXXXXXXXXXXXXXXXXXXXXXXXXXXXXX==
>
* Mark bundle as not supporting multiuse
< HTTP/1.1 200 OK
< X-Aws-Ec2-Metadata-Token-Ttl-Seconds: 21534
< Content-Type: text/plain
< Accept-Ranges: none
< Last-Modified: Thu, 19 Oct 2023 14:06:35 GMT
< Content-Length: 1594
< Date: Thu, 19 Oct 2023 14:10:54 GMT
< Server: EC2ws
< Connection: close
<
{
  "Code" : "Success",
  "LastUpdated" : "2023-10-19T14:06:54Z",
  "Type" : "AWS-HMAC",
  "AccessKeyId" : "AAAAAAAAAAAAAAAAAAA",
  "SecretAccessKey" : "SSSSSSSSSSSSSSSSSSSSSSSSSSSSSSSS",
  "Token" : "xxxxxxxxxxxxxxxxxxxxxxK6TA0q0wSMQzQ4vL40iHhwREJNNJz60BISCivtR0SAGQTXELxxxxxxxxxxxxxxxxxxxxxxxxxxxxxxxxRXDtTdHHLAtX+il6sM4peQbE969MLN21+QY9yihGExxxxxxxxxxxxxxxxxxxxxxxxxxxxxxxxxxxxxxxxCXwBMwvj6aTvnBT3FbtaSMtydYzz=",
  "Expiration" : "2023-10-19T15:34:18Z"
* Closing connection 0
}l
In this case, the accessKeyId and secretAccessKey variables are declared based on the values given when the command is executed.
export accessKeyId=”AAAAAAAAAAAAAAAAAAA”

export secretAccessKey=”SSSSSSSSSSSSSSSSSSSSSSSSSSSSSSSS”
2.3. LogStash
LogStash is an excellent free data pipeline that can be used to ingest data from numerous sources, transform it and send it to a specific destination. This was used to take the results of the cloudsploit scan and import them into elasticsearch.
Logstash was installed simply with “apt install logstash”. After installation, a file was created in the /etc/logstash/conf.d directory called cloudsploit.conf, containing the necessary settings for importing the scan into ElasticSearch.
Below is a configuration example that can be used.
input {
   stdin {}
}

filter {

   mutate {
  	add_field => { "account" => "MyAccountX" }
   }

   csv {
   columns =>
      ["category","title","description","resource","region","statusWord","message"]
   }

   translate {
    	field => "title"
    	destination => "severity"
    	dictionary_path => "/etc/logstash/enrichment/rule-severity.csv"
    	fallback => "no classification"
   }

   translate {
    	field => "title"
    	destination => "cloudslpoit_check_code"
    	dictionary_path => "/etc/logstash/enrichment/rule-code.csv"
    	fallback => "no classification"
   }

   translate {
    	field => "title"
    	destination => "recomendation"
    	dictionary_path => "/etc/logstash/enrichment/rule-recomendation.csv"
    	fallback => "no classification"
   }

   translate {
    	field => "resource"
    	destination => "accepted_risk"
    	dictionary_path => "/etc/logstash/enrichment/rule-acceptedrisk.csv"
    	fallback => "NOK"
   }

   mutate {
    	remove_field => ["host","@version"]
    	add_field => ["scan_version","YEAR-MM-DD"]
   }

}

output {
   stdout { codec=>rubydebug }
   elasticsearch {
      user => "someelasticuser"
      password => "xxxxxxxxxxxxxx"
      index => cloudsploit
   }
}
To put each sub-item in the configuration file into context, we basically have 3 processes: input, filter and output. Each one has its own specific characteristics and, although it’s not the purpose of this article to go into detail about the configuration of the tools, we’ll explain each item a little.
input: in this section we can configure the data to be processed to be read from a file or taken from the standard input. We have opted for the second option.
filter: in the filter you can add other sub-processes, in this case we added “mutate”, “csv” and “translate”.
- mutate: adds or removes a field;
- csv: maps the csv fields from the cloudsploit scan;
- filter: makes substitutions to help correct the information;
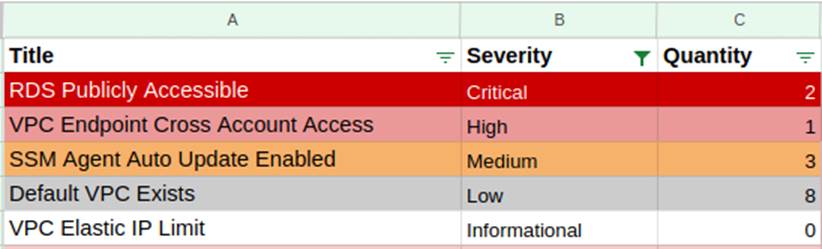
Looking at the mutate and csv code, you can easily infer their functionalities. So we’ll just explain the severity filter. This severity item is used to classify the information coming through the standard input and classify each event as “critical, high, medium or low”.
In the table below are some examples of events that can be placed in the severity enrichment file and their respective classifications.
RDS Publicly Accessible,Critical
VPC Endpoint Cross Account Access,High
SSM Agent Auto Update Enabled,Medium
Default VPC Exists,Low
VPC Elastic IP Limit,Informational
Each line consists of the event description followed by a comma (,) and its severity. This event description comes from the csv file containing the result of the cloudsploit scan, which can change the severity classification based on the company’s security policy or any other criteria that may be adopted.
output: indicates where the processed data will be sent.
To import the CloudSploit scan file available in the /opt/cloudsploit/data directory, you can create a script, as a suggestion in the /opt/cloudsploit/bin directory, to import the data into ElasticSearch.
The following code is just an idea for taking the last scan file from the directory containing the files with the scans and importing it into ElasticSearch.
#!/bin/bash

cs_dir="/opt/cloudsploit"
cs_data="${cs_dir}/data"
logstashconf="/etc/logstash/conf.d/cloudsploit.conf"
cs_scanresult="$(ls ${cs_data} | tail -1)"

/usr/share/logstash/bin/logstash -f ${logstashconf} < ${cs_scanresult}
After executing the last command shown in the table, you can now access ElasticSearch and view the imported results.
2.4 ElasticSearch
ElasticSearch is a distributed, free and open data search and analysis engine for all types of data, including textual, numerical, geospatial, structured and unstructured. In line with the other tools, installing ElasticSearch was also simple, with just an “apt install elasticsearch”. After installation, adjustments were made to the ElasticSearch configuration file (/etc/elasticsearch/elasticsearch.yml), as follows:
cluster.name: project-cloudsploit
path.data: /var/lib/elasticsearch
path.logs: /var/log/elasticsearch
xpack.security.enabled: true
ElasticSearch allows you to create different users with different profiles, but as we’re just giving an example, the “admin” user was used to log in to ElasticSearch.
Once logged in, click on the 3 dashes at the top left and then on Discover, a field will appear for us to type in the query we would like to perform.
The query in Image 3 would only display events with medium severity. However, we could adjust the query to return all events.
Image 4 below shows an illustration of the export of the result of an ElasticSearch query displaying only one item of each severity. With the results displayed, they could be exported to an xls spreadsheet and, if necessary, the spreadsheet could be shared with other teams.
Through the ElasticSearch query, it’s also possible to export each item in more detail so you can know which region and resource needs to be adjusted. As an example, only the item relating to the RDS illustrated in the image above will be displayed.

For the treatment of each item presented there is the possibility of consulting the Trend Micro website to obtain information about the actions necessary to solve the problems displayed. The Trend Micro website mentioned in the previous paragraph is available at:
https://www.trendmicro.com/cloudoneconformity/knowledge-base/aws/.
If you wish to consult the actions to be taken for the “Endpoint Exposed” event, you can access the Trend Micro URL in this format:
https://www.trendmicro.com/cloudoneconformity/knowledge-base/aws/VPC/endpoint-exposed.html.
3. Final considerations
Using the biblical concept of verse 26:41 of the book of Matthew, which reminds us to keep watch and pray, because we never know when the enemy will appear, the implementation of a fault search and alert mechanism proves to be very important in helping to maintain the security of our resources anywhere, especially in the cloud.
The use of a mechanism such as the one mentioned in this article is proving to be very effective in protecting the resources used in the cloud, not only to reduce costs and eliminate waste through the use of unnecessary resources, but also to avoid exposing information and thus compromising access.
If, by any chance, any of the items mentioned here serve as a seed for new ideas or in any way clarify questions about how to implement a misconfiguration detection mechanism that helps those responsible to identify and correct them in order to avoid possible damage caused by information leaks, we’d be happy to help.
4. References
Amazon Web Services. AWS, 1990s. Available at: https://www.aws.com. Accessed on: August 1, 2023.
CloudSploit Aqua Security. CloudSploit, 2020. Available at: https://github.com/aquasecurity/cloudsploit. Accessed on: August 3, 2023.
Elastic Stash. LogStash, 2023. Available at: https://www.elastic.co/logstash. Accessed on: July 28, 2023.
Elastic Search. ElasticSearch, 2023. Available at: https://www.elastic.co/pt/elastic-stack. Accessed on: July 29, 2023.